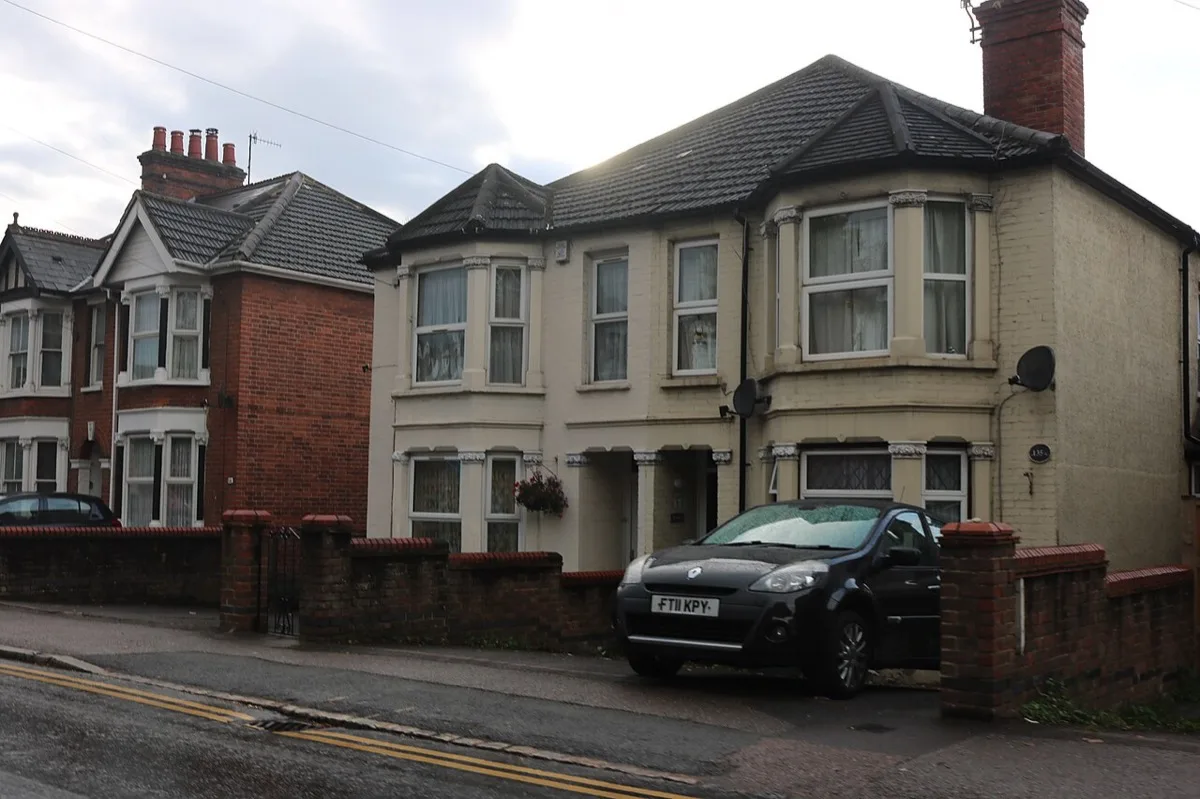

The typical home across the Wycombe area sold for £450,000 in the year to June 2026. Medians by postcode, ward and property type, from 1,583 Land Registry sales.
The typical home across the Wycombe area sold for £450,000 in the twelve months to 30 June 2026. That is the median of 1,583 full-price sales recorded on HM Land Registry’s Price Paid data, which is what buyers and sellers actually signed for rather than what agents asked.
One number cannot describe this patch, though, and the reason is the geography. A quarter of local sales went through under £335,000 and a quarter went over £620,000. Move seven miles from the bottom of the Wye valley to the Thames at Marlow and the median doubles. This page splits the same 1,583 sales by postcode, by ward and by property type so you can find the figure that actually applies to you.
Why the official Buckinghamshire average is not a Wycombe figure
If you look up house prices for this area you will most likely be given £490,508, the UK House Price Index average for June 2026, up 4.3% over the year. That figure is correct, and it is not about Wycombe.
Since the four district councils were abolished in 2020 there is no Wycombe local authority, so the index has no Wycombe geography to publish. The £490,508 covers the whole Buckinghamshire unitary: Aylesbury, Buckingham, Amersham and Chesham as well as High Wycombe and Marlow. It is a county number wearing a local badge.
| Measure | Figure | What it actually covers |
|---|---|---|
| Land Registry median sale, Wycombe area | £450,000 | The middle price of 1,583 full-price sales in HP10 to HP14, SL7 and HP27 in the year to 30 June 2026 |
| UK House Price Index, Buckinghamshire | £490,508 | The mix-adjusted average for the entire unitary in June 2026, Aylesbury and Buckingham included, up 4.3% on the year |
Use the median sale to answer “what is a home round here going for”. It is the middle of a real queue of transactions, so the £4.15 million house that sold on Upper Icknield Way at Bledlow last September cannot drag it about.
Use the index for direction of travel. It is adjusted so that the mix of homes selling in a given month does not distort the trend, which makes it the right number for tracking whether prices are rising and the wrong number for pricing a specific house. On that measure Buckinghamshire rose 4.3% over the year to June 2026, against 0.3% across the South East.
How this page counts
The 1,782 Land Registry records for these seven postcode districts over the year were filtered before anything was averaged. 190 “additional price paid” transfers were removed, because Land Registry flags those as sales that were not at full market value, such as repossessions, part-share transfers and portfolio deals, and warns against using them for market analysis. Every remaining postcode was checked against postcodes.io so that the nine sales that fall over the Berkshire boundary into Windsor and Maidenhead could be set aside rather than folded in. That leaves the 1,583 sales of houses and flats used throughout.
The postcode split, which is the one that matters
| Postcode | Main places | Median sale | Sales |
|---|---|---|---|
| HP11 | Town centre, Desborough, Castlefield | £325,000 | 157 |
| HP13 | Terriers, Totteridge, Micklefield, Hazlemere | £385,000 | 428 |
| HP12 | Sands, Booker, Cressex, Downley | £395,000 | 176 |
| HP14 | Stokenchurch, Lane End, Naphill, West Wycombe | £505,000 | 187 |
| HP27 | Princes Risborough and the Ridgeway villages | £520,000 | 177 |
| HP10 | Flackwell Heath, Loudwater, Wooburn, Penn | £542,400 | 237 |
| SL7 | Marlow, Marlow Bottom, Little Marlow | £650,000 | 221 |
A home in SL7 costs twice what one in HP11 costs. That is the single most useful fact about this market. The valley floor in the middle of High Wycombe, where the terraces and the flats are, is the cheapest place to buy anywhere in the district. Marlow, seven miles south on the Thames, is the dearest. Everything else sits on the slope between them, and it rises fairly steadily as you climb out of the town and into the Chilterns.
The commute does not explain it. High Wycombe is the best-connected of the three towns, 27 minutes direct to Marylebone, while Marlow needs a change at Maidenhead and takes the best part of an hour, and it is Marlow that costs twice as much. Compare the routes on train times to London.
What each kind of home costs
| Type | Median sale | Sales | Share of the market |
|---|---|---|---|
| Detached | £682,500 | 452 | 29% |
| Semi-detached | £460,000 | 470 | 30% |
| Terraced | £405,000 | 303 | 19% |
| Flat or maisonette | £237,500 | 358 | 23% |
The semi-detached house is the standard local home: it is the biggest single category, and at £460,000 it lands within £10,000 of the area median. The gap that does the damage is the one between a flat and a detached house, which is close to £445,000, or roughly the price of a second home.
Flats matter more here than the Chilterns setting suggests. Nearly a quarter of all local sales were flats, and almost all of them are in High Wycombe itself, much of that stock created by office-to-residential conversions in and around the town centre. That concentration is most of the reason HP11 reads as cheap.
New builds barely feature. Only 26 of the 1,583 sales were new homes, at a median of £433,000. Whatever gets built under the Local Plan now going through examination, it has not yet reached the sold-price record: see High Wycombe planning news for what is proposed and where.
Ward by ward
The council publishes ward boundaries, and matching every sale to its ward gives the sharpest picture available of where the money is. Wards with fewer than twenty sales in the year are left out, because the median of a handful of sales tells you nothing.
| Ward | Median sale | Sales |
|---|---|---|
| Chiltern Villages | £684,000 | 21 |
| Ridgeway East | £660,000 | 63 |
| Marlow | £650,000 | 201 |
| Penn, Tylers Green & Loudwater | £538,750 | 100 |
| Flackwell Heath & The Wooburns | £501,750 | 144 |
| Ridgeway West | £495,000 | 112 |
| Princes Risborough | £482,500 | 154 |
| Downley | £457,500 | 62 |
| West Wycombe & Lane End | £430,000 | 49 |
| Booker & Cressex | £405,000 | 61 |
| Abbey | £402,500 | 116 |
| Totteridge & Bowerdean | £392,500 | 92 |
| Sands | £392,500 | 67 |
| Terriers & Amersham Hill | £380,000 | 117 |
| Disraeli | £375,000 | 53 |
| Marsh & Micklefield | £325,000 | 117 |
| Castlefield & Oakridge | £300,000 | 49 |
Read down that column and the shape of the town appears. The cheapest four wards, Castlefield and Oakridge, Marsh and Micklefield, Disraeli and Terriers and Amersham Hill, are all inside High Wycombe and account for 336 sales between them. The dearest, at more than double, are the rural wards and Marlow. Castlefield and Oakridge at £300,000 and Chiltern Villages at £684,000 are eleven miles apart and served by the same council, the same hospital and the same station.
Hazlemere had only five recorded sales in the year, too few to publish a median from, which is a quirk of where the ward boundary falls rather than a sign of a frozen market. Most housing that people call Hazlemere sits in the Terriers and Amersham Hill or Ridgeway East wards.
Frequently asked questions
What is the average house price in High Wycombe?
The median sale across the Wycombe area was £450,000 in the year to 30 June 2026, from 1,583 full-price Land Registry sales. Inside High Wycombe itself prices are lower than that: the HP11 town-centre postcode had a median of £325,000 and HP13 £385,000.
Why do other sites quote a different figure?
Most quote the UK House Price Index average of £490,508 for June 2026, which covers the whole Buckinghamshire unitary including Aylesbury and Buckingham. There has been no Wycombe council since 2020, so no official index for Wycombe alone exists. The Land Registry sales on this page are filtered to the Wycombe-area postcodes instead.
Is Marlow really twice the price of High Wycombe?
By postcode, close to it. The SL7 median was £650,000 against £325,000 in HP11, so the same money buys twice the house seven miles up the road. Marlow ward on its own had a median of £650,000 across 201 sales.
What does a flat cost in High Wycombe?
The median flat or maisonette sold for £237,500. Flats were 358 of the 1,583 local sales, nearly a quarter of the market, and most of that stock is in and around High Wycombe town centre.
Are prices going up?
The UK House Price Index has Buckinghamshire up 4.3% in the year to June 2026, against 0.3% across the South East. Every release revises the month before it: May 2026 was first published at £486,000 and now reads £487,002. That is a county-wide measure, so treat it as the direction of travel rather than a Wycombe figure.
Where can I check what a specific house sold for?
Every completed sale in England and Wales is public. Search a street or an address for free on HM Land Registry Price Paid.
Sources
- HM Land Registry Price Paid data for all 1,583 sales, medians, property types, wards and postcode districts.
- UK House Price Index, Buckinghamshire (ONS and HM Land Registry) for the county average, annual change and South East comparison.
- postcodes.io for matching every sale postcode to its council area and ward.
- HM Land Registry Price Paid search to look up any individual address.
Figures are provisional and revised as more sales are registered. Contains HM Land Registry data © Crown copyright and database right 2026, licensed under the Open Government Licence v3.0.
Have your say